Diagnostic Tool
DNA as Diagnostic Tool
A DNA test, or genetic test, analyzes a person's DNA to identify changes in their genetic material. This can help determine if a person has a genetic condition or is at risk of developing one.
Applications of DNA as a Diagnostic Tool
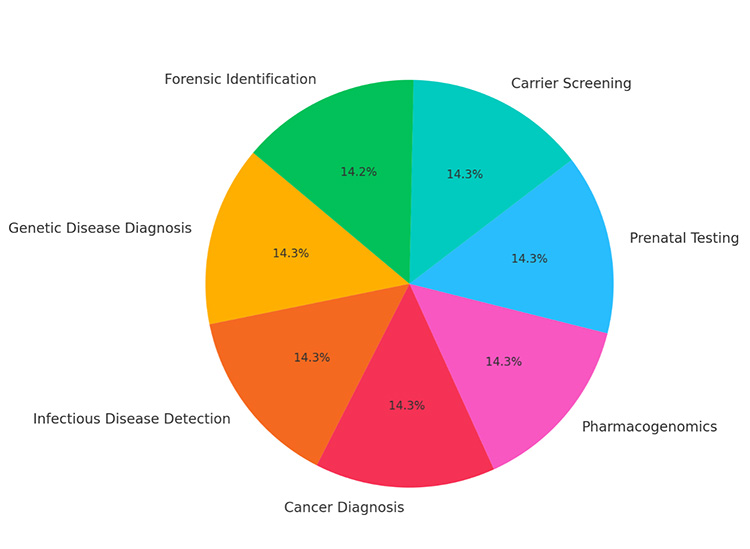
Here is a pie chart illustrating various applications of DNA as a diagnostic tool, including areas like genetic disease diagnosis, infectious disease detection, cancer diagnosis, pharmacogenomics, prenatal testing, carrier screening, and forensic identification. Each category is represented with equal distribution for simplicity, but these proportions can vary depending on specific use cases or data.
- Genetic Testing (e.g., for ancestry, medical diagnostics, forensics)
- DNA Sequencing (e.g., in research, personalized medicine)
- DNA Data Storage
- CRISPR and Gene Editing applications
Based on general estimates for genetic testing usage worldwide, I'll create a pie chart with the following categories and approximate percentages:
- Ancestry Testing: 40%
- Medical Diagnostics: 35%
- Forensic Analysis: 15%
- Paternity Testing: 10%
Here's the pie chart showing the estimated worldwide usage of genetic testing across different categories. Ancestry testing leads with 40%, followed by medical diagnostics at 35%, forensic analysis at 15%, and paternity testing at 10%.
Gene Therapy
Common categories in gene therapy might include:
- Cancer Treatment
- Inherited Genetic Disorders
- Cardiovascular Diseases
- Neurological Disorders
- Others
INHERITED DISEASES
Here are some possible categories:
- Muscular Dystrophy
- Cystic Fibrosis
- Hemophilia
- Sickle Cell Disease
- Other Inherited Disorders
Here's the pie chart showing the estimated usage of gene therapy for various inherited genetic diseases. Muscular dystrophy is represented as the largest category at 25%, followed by cystic fibrosis, hemophilia, sickle cell disease, and other inherited disorders.
Pie chart representing gene therapy usage specifically for colon cancer, based on general estimates or related categories within cancer treatment. Common categories might include:
- Early-Stage Colon Cancer
- Metastatic Colon Cancer
- Immunotherapy Enhancement
- Targeted Gene Therapies
- Other Cancer Treatments
Here's the pie chart showing the estimated usage of gene therapy for colon cancer. Metastatic colon cancer has the largest share at 30%, followed by immunotherapy enhancement, early-stage colon cancer, targeted gene therapies, and other cancer treatments.
For a pie chart representing gene therapy usage in neurological diseases,
- Parkinson's Disease: 30%
- Alzheimer's Disease: 25%
- Amyotrophic Lateral Sclerosis (ALS): 20%
- Huntington's Disease: 15%
- Other Neurological Disorders: 10%
The pie chart using these estimates.
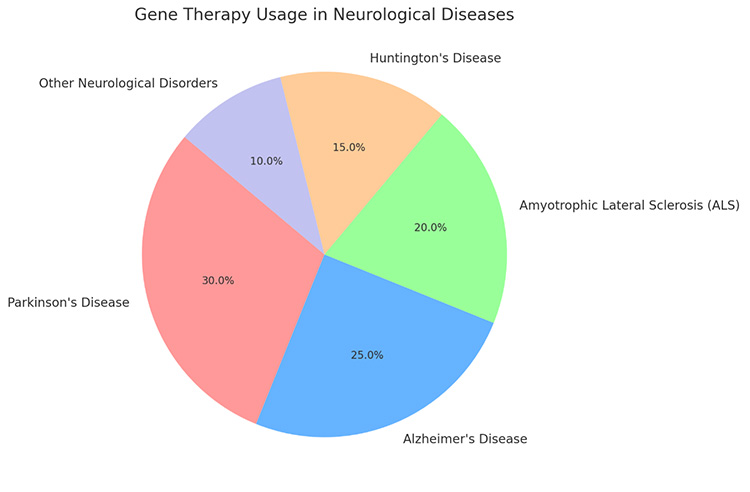
Here's the pie chart representing gene therapy usage in neurological diseases, with estimates for each category. The chart shows the distribution across Parkinson's Disease, Alzheimer's Disease, Amyotrophic Lateral Sclerosis (ALS), Huntington's Disease, and other neurological disorders based on general estimates.